
Before You Start
- Prepare for Recording: Ensure you have a screen recording tool in place, such as the Microsoft Snipping Tool, to capture the steps before you reproduce the error. This will help provide context alongside the logs.
1. Open Developer Tools:
-
- Open your Prokeep Inbox and right-click anywhere on the page.
- Select "Inspect" at the bottom of the menu

2. Configure Developer Tools
- In the Developer Tools panel, click on the settings gear icon (⚙️) located at the top-right corner to select Preferences.
- Under the Network section, check the Preserve log box.
- Under the Console section, check the Preserve log box and also check the Log XMLHttpRequests box.
- Click the "X" within the Settings menu
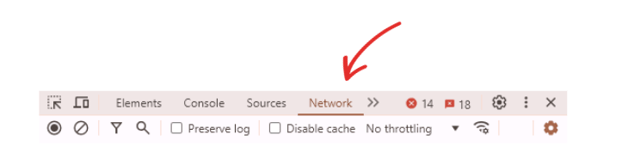
- With Developer Tools open, click "Network"
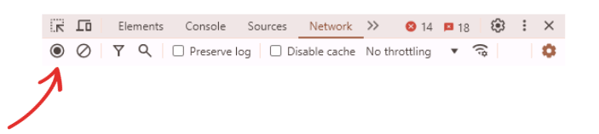
- Click on the record button
-
- Refresh your screen
- Proceed to reproduce the error you are encountering in Prokeep
4. Save HAR File
-
- Once you've reproduced the error, right-click within the "Network" tab in your Developer Tools and select "Save as HAR with Content"
- Save File

5. Sharing Logs
- Provide the saved console log and HAR file to your support team by emailing support@prokeep.com